
If you need further assistance, our support staff is available during normal business hours (EST) at 412.231.2020 ext 1. For critical issues, you can reach us 24/7 at the same number. HMS is committed to providing excellent customer care.
Bulletin: Race/Ethnicity: Issue with Updating Patient Details
Introduction
During the PA Emergency Department Data Collection work that is being done as part of the “PA Data Enhancements Project” (P22.007), we encountered a specific behavior within our product regarding how the Race/Ethnicity fields were populated for some patients. After investigating how this data was handled, we realized that if patients having a prior visit in EpiCenter return to a facility, our system did not update the standardized Race/Ethnicity values even if there was a change after processing the raw Race/Ethnicity value since they were already populated from the original visit. This caused our system to report a lower percentage on Race/Ethnicity than we are actually receiving. It is important to note that all of this data is securely captured in our database, it is just not reflected properly in EpiCenter in some instances. We are working to fix this issue.
This issue occurred because most facilities historically did not send any meaningful information in these fields, so our system was originally designed not to repopulate these fields when there were new visits for repeat patients. Thankfully, Race/Ethnicity data reporting has improved immensely over the past few years and is now largely standardized and accurate. We plan to implement a long-term solution to this issue in the next EpiCenter release. In the interim, a short-term solution is outlined below.
Interim Solution
We have adjusted our data completeness report to account for any updated Race/Ethnicity mapping. We can calculate completeness for just the subset of patients who are new to the facility or have a new patient identifier. This report will be used to track progress in the current PA Emergency Department Data Collection work.
Long-Term Solution
Our long-term solution will be included in the upcoming EpiCenter release. The solution is threefold:
- A tool is developed to retroactively re-apply those administratively configured mapping rules so that a raw Race/Ethnicity value can be correctly converted to their corresponding standardized Race/Ethnicity value.
- When processing HL7 messages in real time, if a patient initiates a new visit to seek healthcare, her/his most recent demographic information (including the raw Race/Ethnicity value and the standardized Race/Ethnicity value) will be used to create a new Patient Record for her/his current visit.
- When processing HL7 messages in real time, if a patient reports new demographic information during the same visit, her/his most recent Race/Ethnicity value will be used to update her/his current Patient Record if Race/Ethnicity value was previously absent.
Bulletin: Composed Classifiers
Introduction
All Emergency Department Registration data coming into EpiCenter is automatically classified by the system. Classifications are categories or tags associated with each healthcare interaction that are used by EpiCenter’s Syndromic Surveillance and other analyses. Classifiers are groupings of conceptually similar classifications.
Classifications for Acute Care Interactions are based on an individual data field. Most commonly this is the “chief complaint” field, but others such as diagnosis code can be considered as well. Health Monitoring also supports the definition of “composed classifiers”, which combine evidence across multiple classifications. This bulletin provides more detail about composed classifiers and how they work.
Details of Clarification
Evidence Classifications
EpiCenter’s system classifications for acute care interactions are based on individual, discrete pieces of evidence. Many classifications are based on chief complaint, medical notes, or observations, all of which are free-text fields. Classifications based on free-text fields are defined by the inclusion of one or more words or phrases and an optional list of negative words or phrases. If an interaction’s text field matches the definition of the classification, the classification will be tagged to the interaction. An interaction can have multiple classifications from multiple classifiers applied to it.
To use a simplified example, the “Suicidal Ideation” chief complaint evidence classification searches for chief complaints that include the word “suicide” but not the phrases “denies self-harm” or “accident.”
Other classifications are based on diagnosis code. Instead of parsing a free-text field, these classifications simply search for a specific diagnosis code or codes. For example, the “Flu Diagnosis” evidence classification looks for ICD9 or ICD10 codes corresponding to influenza.
Composed Classifiers
Composed classifiers are based on multiple pieces of evidence, using combinations of classifications. Composed classifiers can use the logical operations AND, OR, and NOT.
For example, the “Suicidal Ideation” composed classifier looks for interactions tagged with either the “Suicidal Ideation” chief complaint evidence classification described above, OR the “Suicidal Ideation” classification based on diagnosis code OR the “Suicidal Ideation” classification based on text evidence found in medical notes.
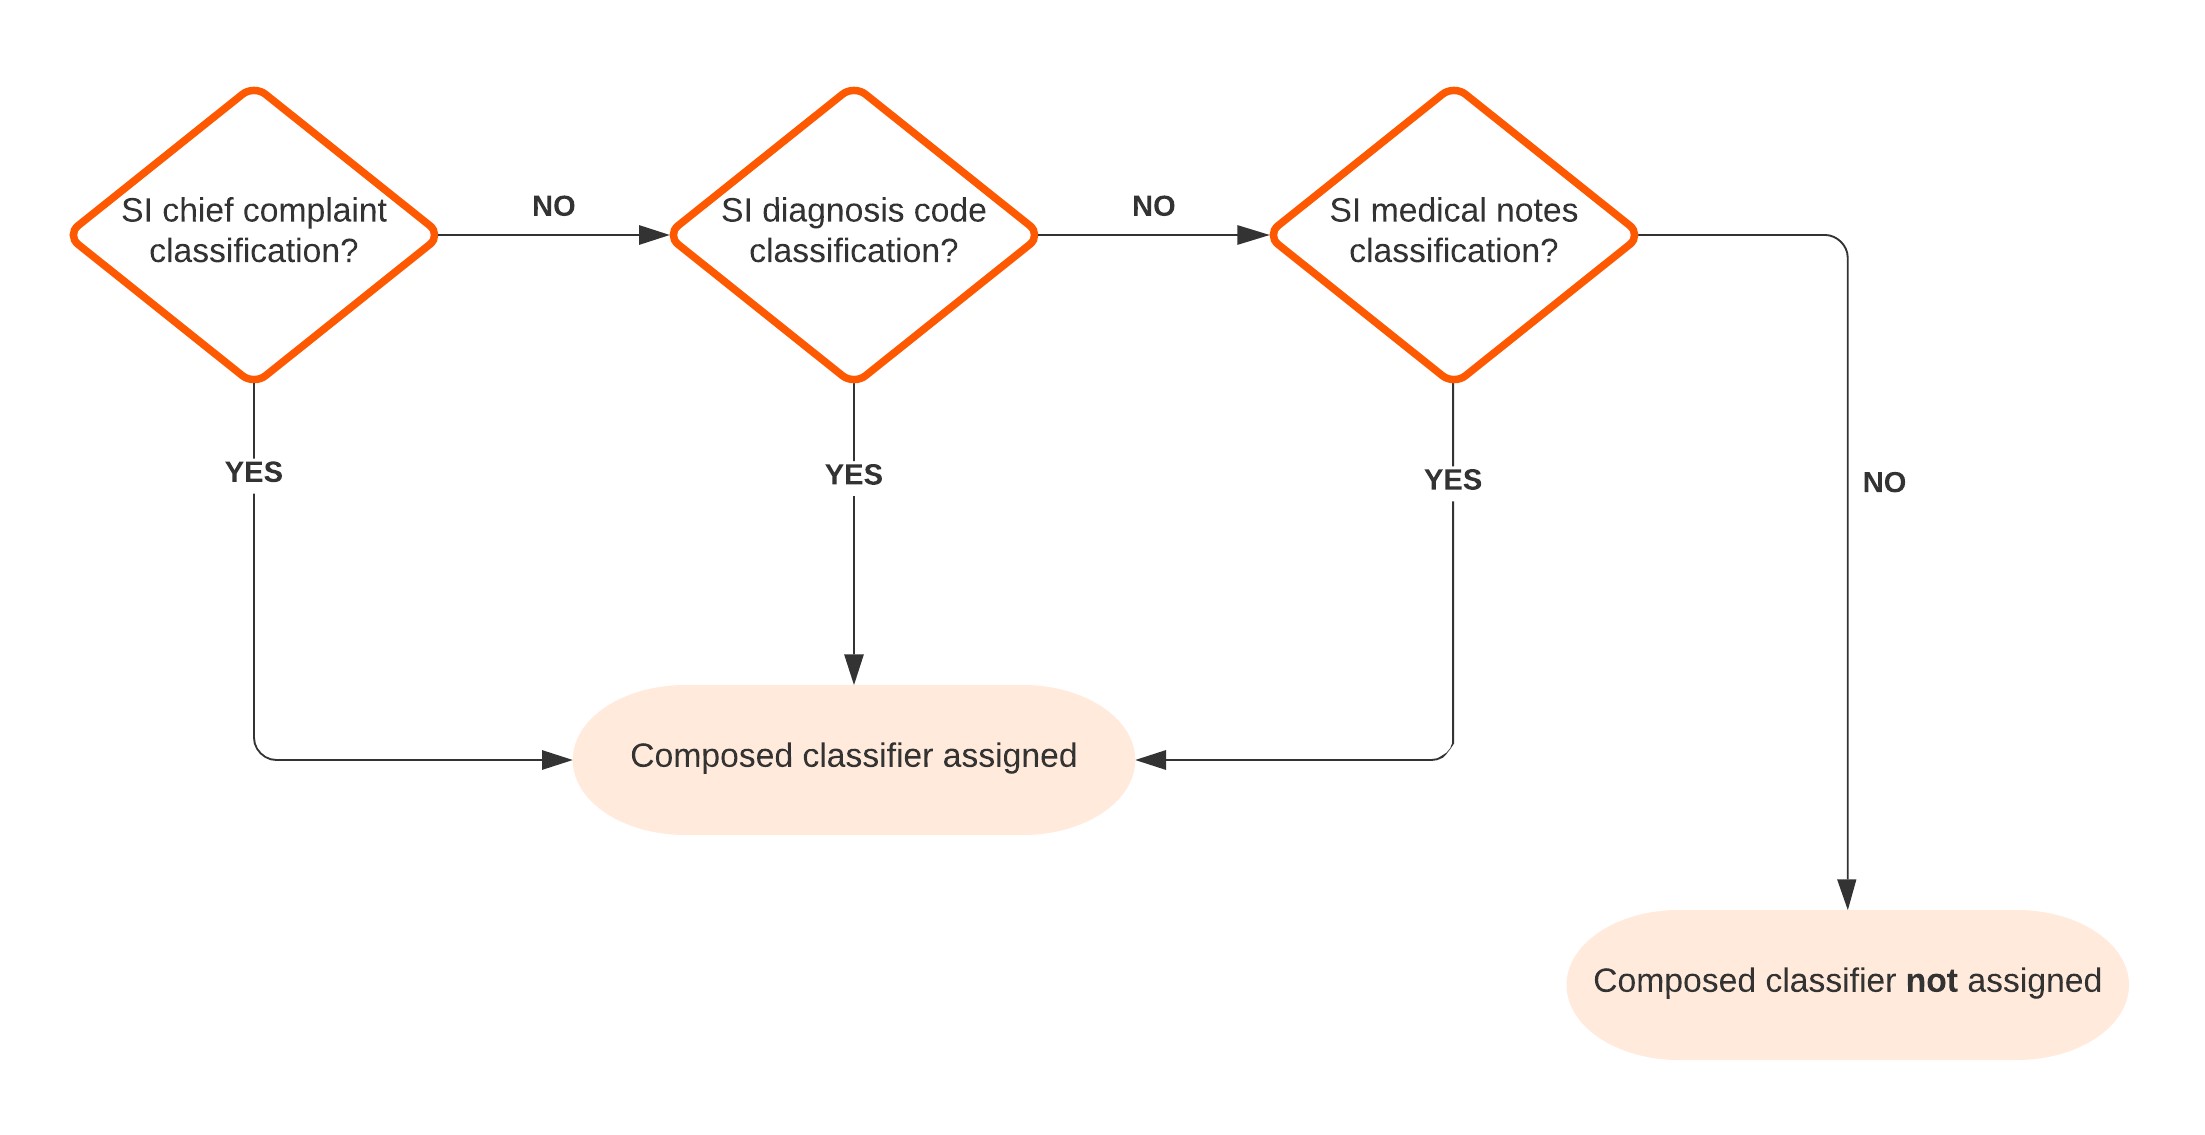
Figure 1 – Suicidal Ideation Composed Classifier Flow Chart
As another (simplified) example, the “COVID-19 Symptoms (Broad)” composed classifier looks for interactions tagged with EITHER the “COVID-19” diagnosis evidence classification OR a “Fever” classification from chief complaints, medical notes, or vital signs AND at least one of a “Cough” or “Dyspnea” classification from chief complaints or medical notes AND NOT an “Influenza” diagnosis classification.
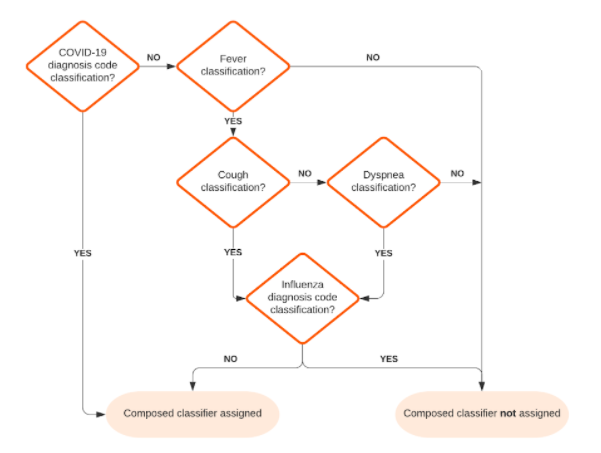
Figure 2 – Simplified COVID-19 Symptoms (Broad) Composed Classifier Flow Chart
Impact
No changes are planned to existing system classifiers or classifications. Development of new composed classifiers can be supported as a customization.
Bulletin: Data Flow from Facilities to EpiCenter
Introduction
EpiCenter uses healthcare data as the input for Syndromic Surveillance, Visit Monitoring, Treatment Monitoring, and custom reports.. This bulletin provides specifics around how data flows from facilities to EpiCenter.
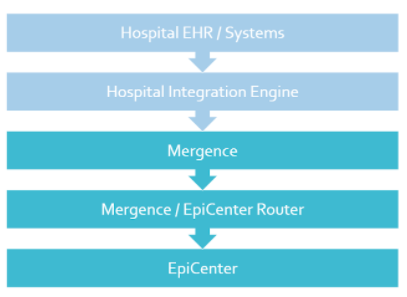
Figure 1 – Data Flow from Hospital to EpiCenter
Clarification on Data Flow
Hospital Systems
Facilities send electronic healthcare data to EpiCenter according to Health Monitoring’s Data Transmission Guidelines. The primary data format supported is the Health Level Seven (HL7) standard, with limited support available for CSV, TXT, CDA, and XML formats. The HL7 standard defines the language, structure, and data types for packaging and sending electronic health information and is platform-independent. Health Monitoring captures a limited patient-specific dataset for use in EpiCenter and supports transmission of facility data that accords with The Public Health Information Network (PHIN) Messaging Guide for Syndromic Surveillance.
Because HL7 is already used in virtually all healthcare facilities, there is minimal effort required from facility personnel to set up a connection with Health Monitoring Systems via VPN. The VPN provides a dedicated, secure network tunnel for a facility, enabling a one-to-one, encrypted connection to Health Monitoring servers.
Mergence and Health Central Databases
After being sent from a facility, encrypted HL7 messages are stored in Health Monitoring’s Mergence database. Mergence is a high-performance data processing system that is resilient to failure, supporting hundreds of simultaneous data connections. From Mergence, EpiCenter’s sender configuration assigns each HL7 message to a “router worker” based on the sending facility so that messages from a given facility are processed in chronological order. The number of router workers is elastic and can be ramped up or down depending on incoming message volume. Once a message is assigned to a router worker, it is decrypted and sent to a second database, Health Central.
When a message arrives in the Health Central database its data is extracted and transformed into various relational tables which makes querying the data more efficient. The Health Central database is the basis for the EpiCenter application, its surveillance tasks, and all other analyses.
The Vault
While most data collected for use in EpiCenter is considered a limited dataset by HIPAA, there are some components such as clinician notes that may contain more sensitive information. These fields are encrypted and stored in the “Vault”, a separate component from Health Central. For more details on the Vault, please see the “Reviewing Vault Access by Users” bulletin.
Bulletin: Reviewing Vault Access by Users
Introduction
Syndromic Surveillance collects a limited data set from participating healthcare facilities. Under HIPAA, limited datasets do not require the same high security standards for data at rest and data in motion. With the collection of data beyond Syndromic Surveillance data, which is not part of an evaluated limited data set, there is greater concern regarding handling of PHI and Other Sensitive Information (POSI).
To address this concern regarding proper handling of POSI, Health Monitoring has implemented a new component within EpiCenter (the Vault) and introduced audited access to data which may contain POSI. EpiCenter users are prompted to enter a POSI Access Reason as well as provide a password verification in order to access reports that include POSI.
Vault Report Access Tracking
Health Monitoring has created a set of three reports that allows the appropriate personnel to see which EpiCenter users, within their region, have accessed the Vault along with their POSI Access Reason.
Each of the three reports serves a different purpose. The “Find Vault Report Usage” report shows each execution of a report per line. The “Find Vault Audit Entries” report shows each retrieval of a piece of sensitive information per line. The “Find Vault Value Entries” report is not listed directly under the Reports menu, as is it a pivot form the “Find Vault Audit Entries” report. This report shows the access history for a particular piece of sensitive information; one access per line (access types can be Create, Read, Write, etc.).
Effective Date
These three reports have been implemented into the Production environment and the appropriate users will be granted access to them.
Bulletin: EpiCenter Browser Support (Internet Explorer 11 End-of-Life)
Health Monitoring continues ongoing support of EpiCenter for the Google Chrome and Microsoft Edge browsers.
As of November 30, 2020, Microsoft has stopped supporting Internet Explorer 11 (IE 11), as noted in the Microsoft announcement1 published on August 17, 2020. This discontinuation may affect EpiCenter’s stability in IE 11.
Impact on EpiCenter
With Microsoft’s ceased support for IE 11, Health Monitoring Systems cannot guarantee that EpiCenter will be fully functional using the IE 11 web browser after the 3.5.21 EpiCenter Release. Health Monitoring recommends using Google Chrome for EpiCenter.
Bulletin: Date/Time Granularity in Maps, Reports, Quick Charts, and Pivot Charts
This bulletin discusses how time increments are handled in EpiCenter’s Maps tab (e.g., maps and Quick Charts) and in the Reports tab (e.g., in custom report maps and related Pivot Charts).
Users typically select an increment of time (hour, day, week, or month) as the basis for their data analysis. To work with data from a given period, users select the end date they want and then specify an amount of time (in hours, days, weeks, or months) leading up to that date.
In the Maps Tab
For analyzing current data totaled by day, the Maps tab applies the current time of day by default, and defines each day as a 24-hour period ending at that time. The presumption is that the user wishes to see current analysis.
For analyzing historical data that is totaled by day, or for analyzing any data that is totaled by week or month, the Maps tab uses as its time frame the calendar day, week, or month containing the date keyed into the input selector.
A calendar week corresponds to an MMWR week, running from Sunday to Saturday. See https://wwwn.cdc.gov/nndss/document/MMWR_Week_overview.pdf for details.
A calendar month extends from 00:00 on the first day of the month to 23:59 on the last day of the month.
If the “Enable Hours” option is activated, the Maps tab’s input selector will accept hour specifications and apply them when totaling data by hour or day. When data is totaled by week or month, the system will accept hour specifications but will not apply them.
Supported Analysis Methods
- Exponential Moving Average Probability, Recursive Least Squares Probability, and Simple Moving Average Probability support data totaling by day only.
- Poisson supports data totaling by hour and day.
- Total Counts support data totaling by hour, day, week, and month.
In the Reports Tab
For analyzing current data totaled by day, Report maps permit users to specify a time in the input selector; a 24-hour period ending at that time constitutes one day. Hours and minutes may always be specified, and when totaling by day the specified time is always applied.
For analyzing historical data that is totaled by day, or for analyzing any data that is totaled by week or month, Report maps function just like those in the Maps tab.
Week and month definitions remain the same.
In effect, the “Enable Hours” functionality is built into Report maps, in that time specifications are allowed at all times. However, as in the Maps tab, time specifications are only applied when data is totaled by hour or day. When totaling by week or month, the system will accept time specifications but will not apply them.
Supported Analysis Methods
- Exponential Moving Average Probability, Recursive Least Squares Probability, Cumulative Sum – EMA Probability, Simple Moving Average Probability, and Poisson support data totaling only by day.
- Total Counts support data totaling by hour, day, week, and month.
In Quick Charts and Pivot Charts
Added historical context is provided via the Quick Chart option.
Quick Charts depict data from a trailing window of at least 30 days. Accompanying the chart are case details for each patient.
A “Patient Details” option is also available from the Pivots submenu on Report maps. Users specify their desired time frame, which can be expressed in hours, days, weeks, or months.

Bulletin: How EpiCenter Manages User Passwords
EpiCenter offers a set of built-in password complexity rules intended to enhance password security. EpiCenter customers may enable any subset of these rules to restrict user passwords. When no password rules are enabled, EpiCenter will allow users to choose passwords without restriction. Passwords may be of any length and contain any combination of character types (upper/lower case letters, numbers, or punctuation).
Password Rules Supported by EpiCenter
As of the release of EpiCenter version 3.5.18, the password validation rules are as follows:
- The password must be at least 8/9/10/12 characters (length to be selected by the customer).
- The password must contain 1-digit character.
- The password must contain at least 1 lowercase character.
- The password must contain at least 1 non-alphanumeric character.
- The password must contain at least 1 uppercase character.
- The password must not contain any whitespace.
- The password must not contain the person’s username, spelled either forward or backward.
- Lock account for a certain length of time after a certain number of failed login attempts.
- Length of time and number of failed login attempts must be specified by the customer.
- The password will expire after a certain number of days.
- The number of days must be specified by the customer.
If an organization enables one or more of the above password selection rules, EpiCenter will enforce all enabled rules for all new passwords. In other words, a chosen password must conform to every rule that has been activated. If any of the enabled rules is violated, the password is invalid and the system will disallow it.
Bulletin: Change in Definition of Chief Complaint Opioid-Related Evidence Classifier
Effective date: July 1, 2018
Health Monitoring’s evidence classifiers incorporate data from emergency department chief complaints, diagnosis codes, and clinical notes. Each classifier contains the classifications related to the data type. Each classification is defined by a particular set of keywords in conjunction with an absence of specified negative indicators.
Definition Change
At the request of the Connecticut Department of Health, two new brand names have been added to the Chief Complaint Opioid-Related Evidence Classifier.
The keywords “tramadol” and “hydromorph” are being added to that classifier’s Substance Opioid Brand classification. The relevance of these changes was deemed sufficiently universal and the impact on existing classifications sufficiently minor as to warrant applying them globally.
Impact on Existing Classifications
Since January 1, 2015, the start point for applying opioid-related classifications retroactively, there have been 2,852 chief complaints containing “tramadol” and 48 containing “hydromorph.” For “tramadol” that averages to roughly 2 per day systemwide, and thus less than 1 per day per state. Of those, 174 (169 “tramadol,” 5 “hydromorph”) contain sufficient additional information to warrant the classification “Suspected overdoses involving any opioid.” That works out to an average of 8 additional suspected opioid overdoses per year per state. The other two overdose categories will not be affected by this change.